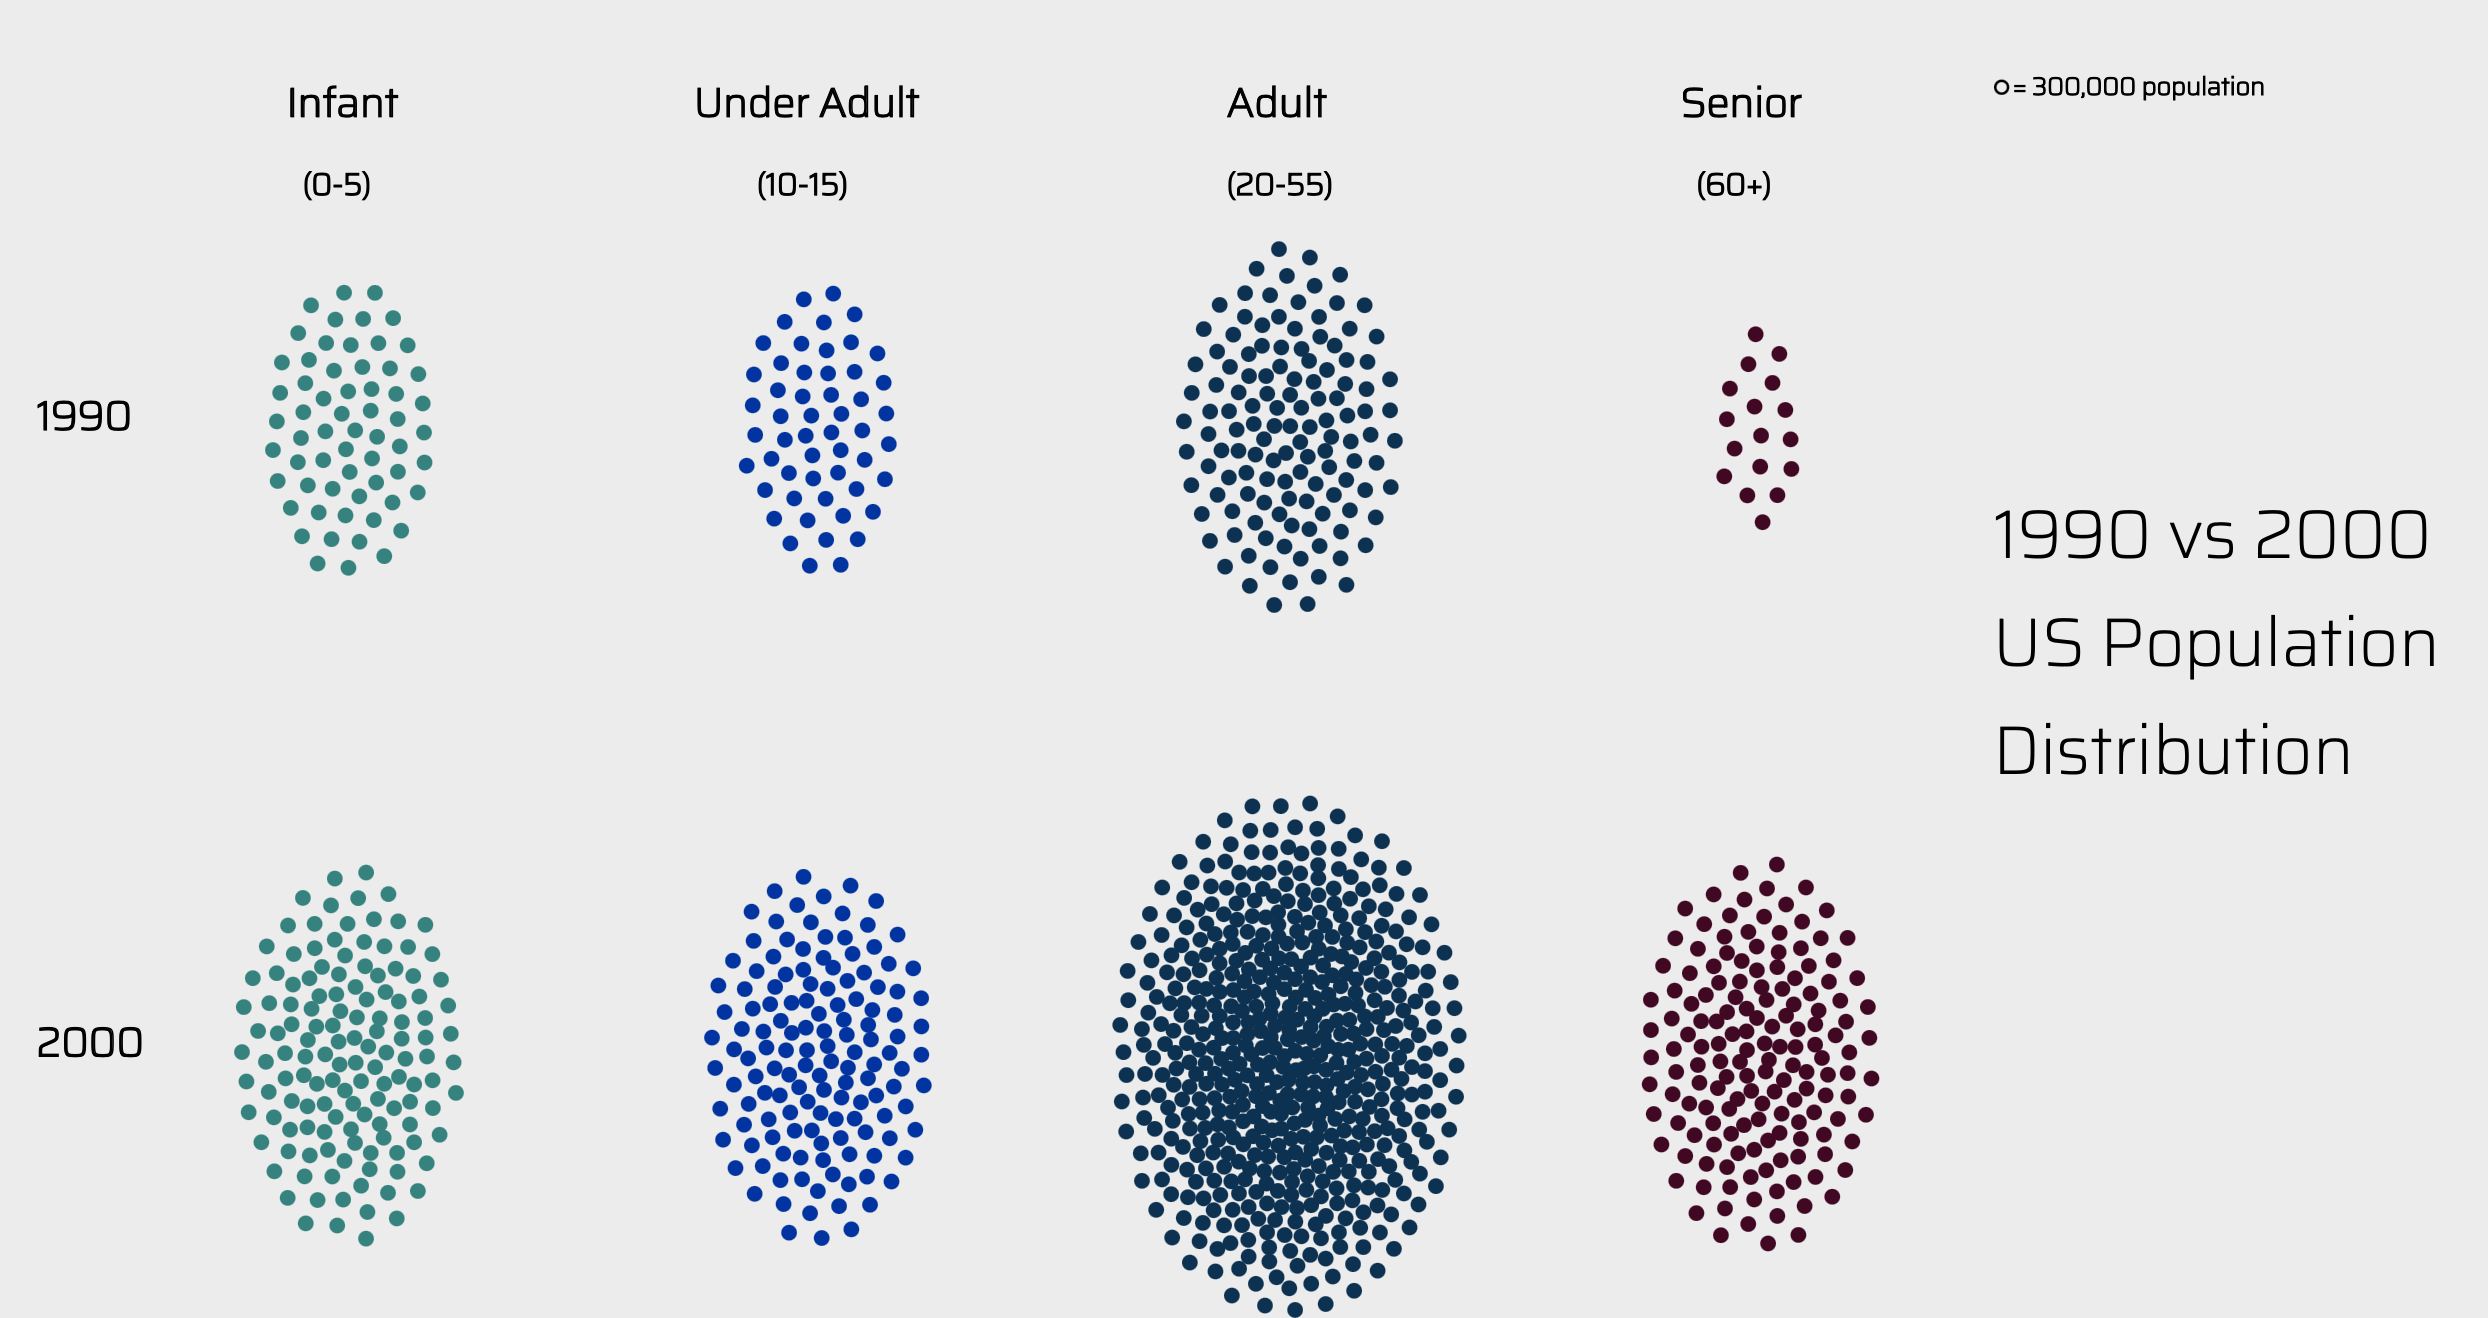
1990 vs 2000 US Population Distribution
Designed and Developed by: Yujia Huo
https://www.census.gov
View the project
The visualization experiments with a new form of presentation, going beyond the traditional population pyramid. It adopts a more creative and metaphorical approach to depict the data.
Design Process

Research Question
How has the age distribution of the U.S. population evolved from 1990 to 2000?
Visual References
I search on Pinterest to see the visualization relate to population density. Which is another way to visualize amount of population. I found that the population density visualization more attempt to use clusters to shows the feeling of density. And also the real life reference of traffic on the highway in the night give me inspiration.

Design Detail
Visualization Form
How has the age distribution of the U.S. population evolved from 1990 to 2000?
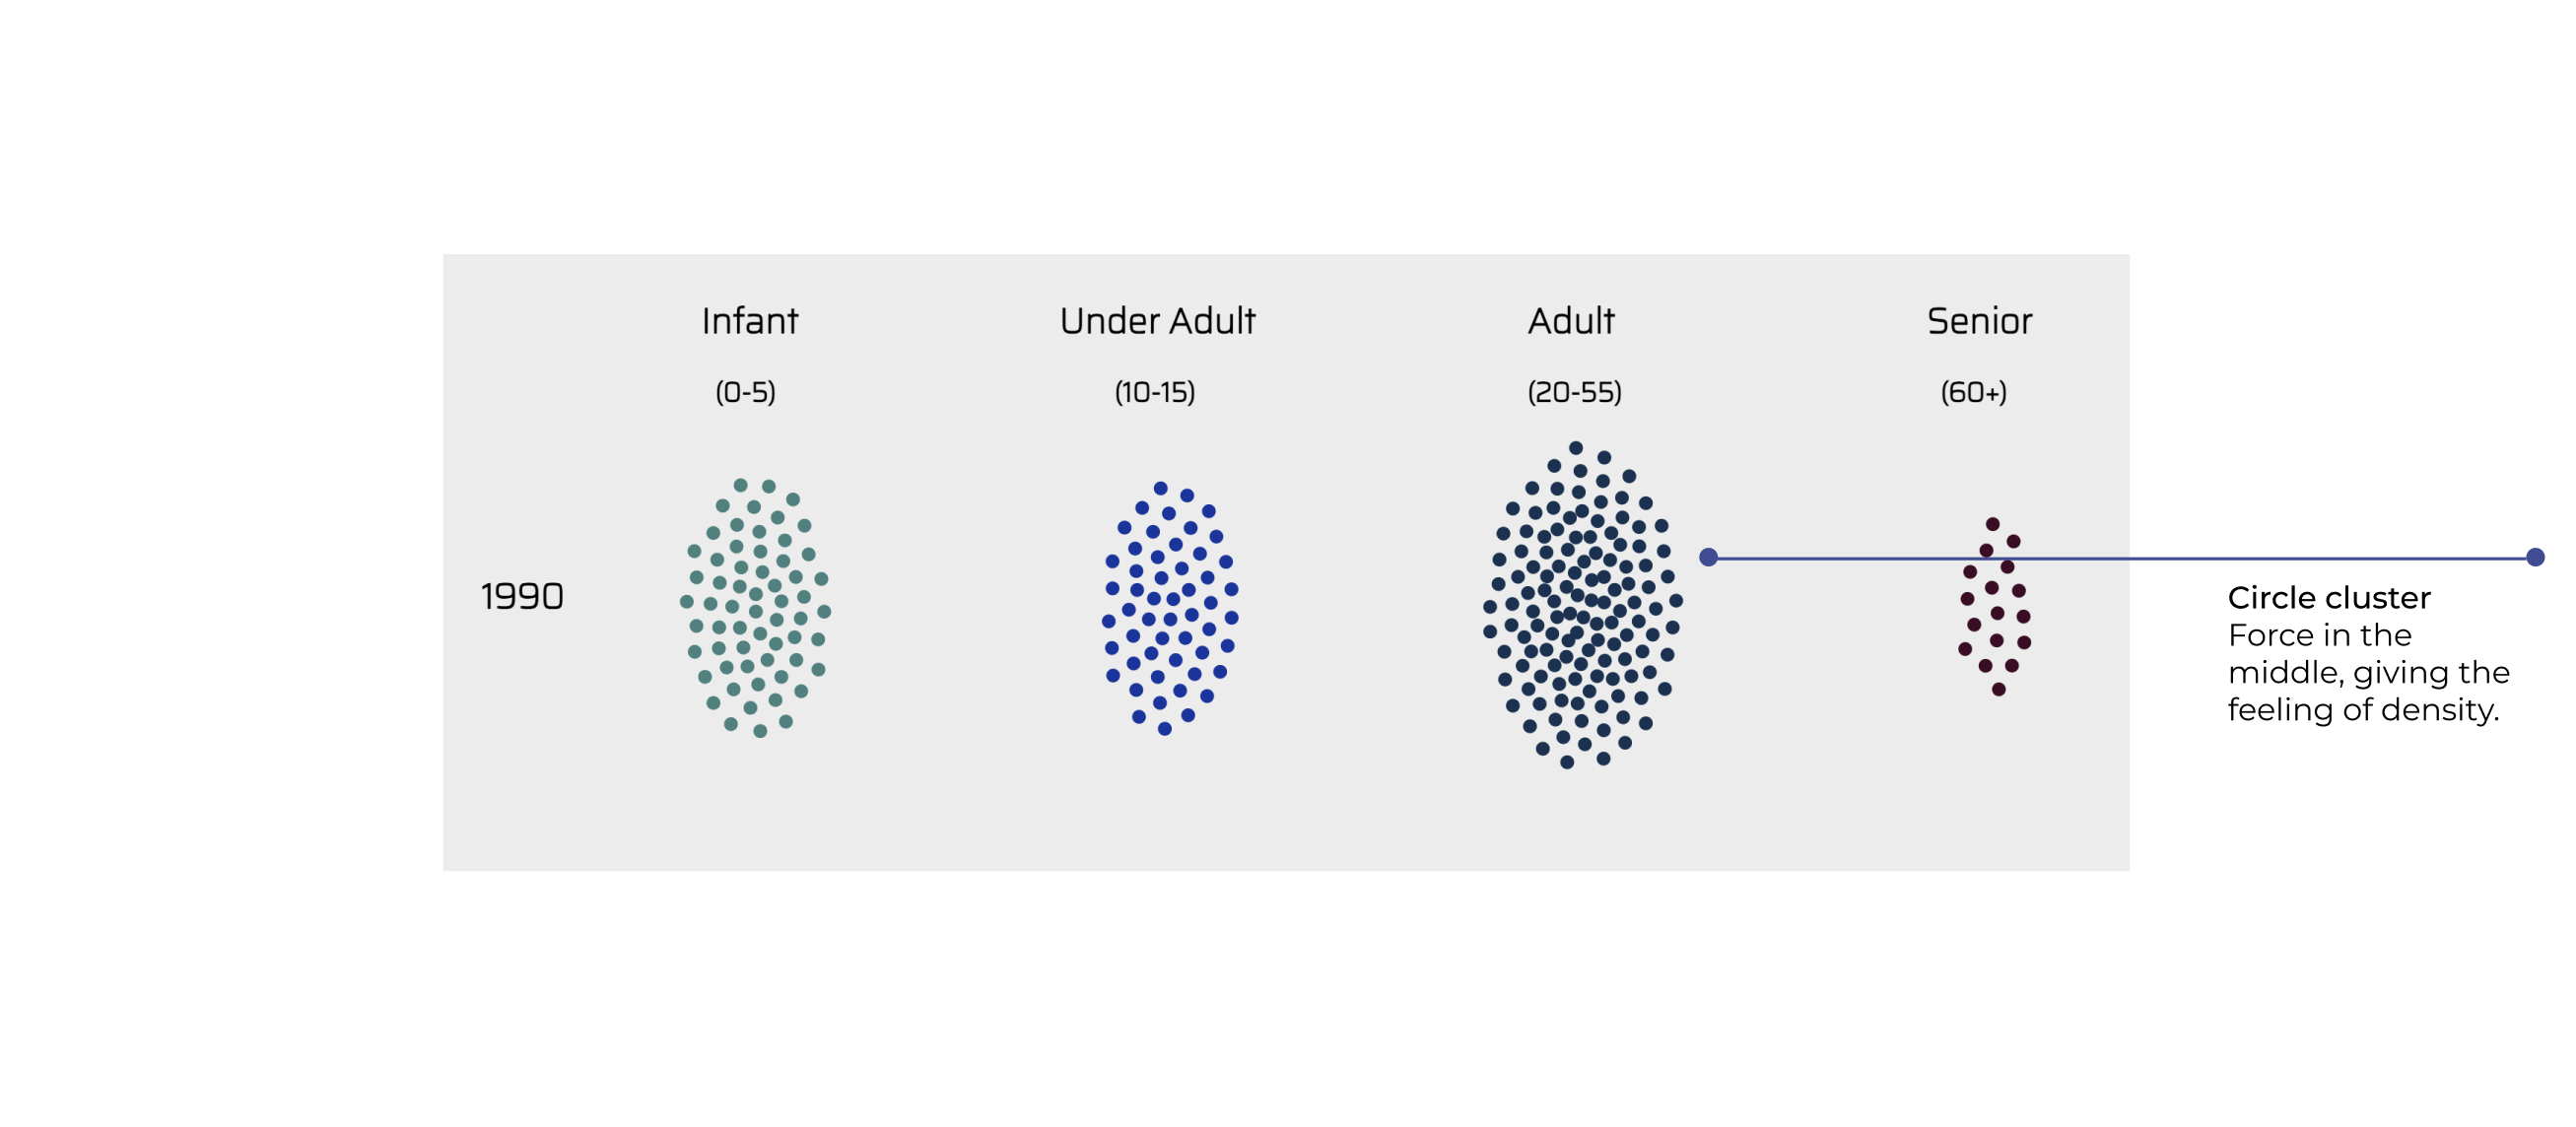
The circle cluster shows clear density of population size for each group, supporting comparison.