Modeling Religious Change
Designed and developed by: Yujia Huo
View the project
My Role
As Data Visualization Specialist
Design and develop Visualization for two main audiences
General Public: Provide contextualize knowledge relate to MRC research process through blog post.
Scholars: Provides visual representation of the data to support publication statements.
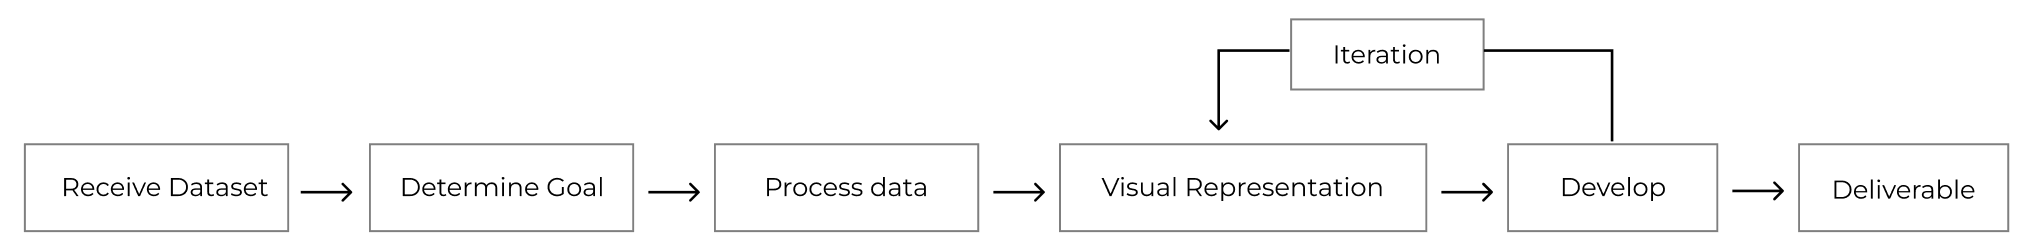
Design Process
General Public - Design Detail
Color:
I choose to use Tableu 10 as the color scheme to maintain softer, more sophisticated, less “Crayola bright.”

Form:
Based on each blog post’s goal, static, motion graphic, or interactive
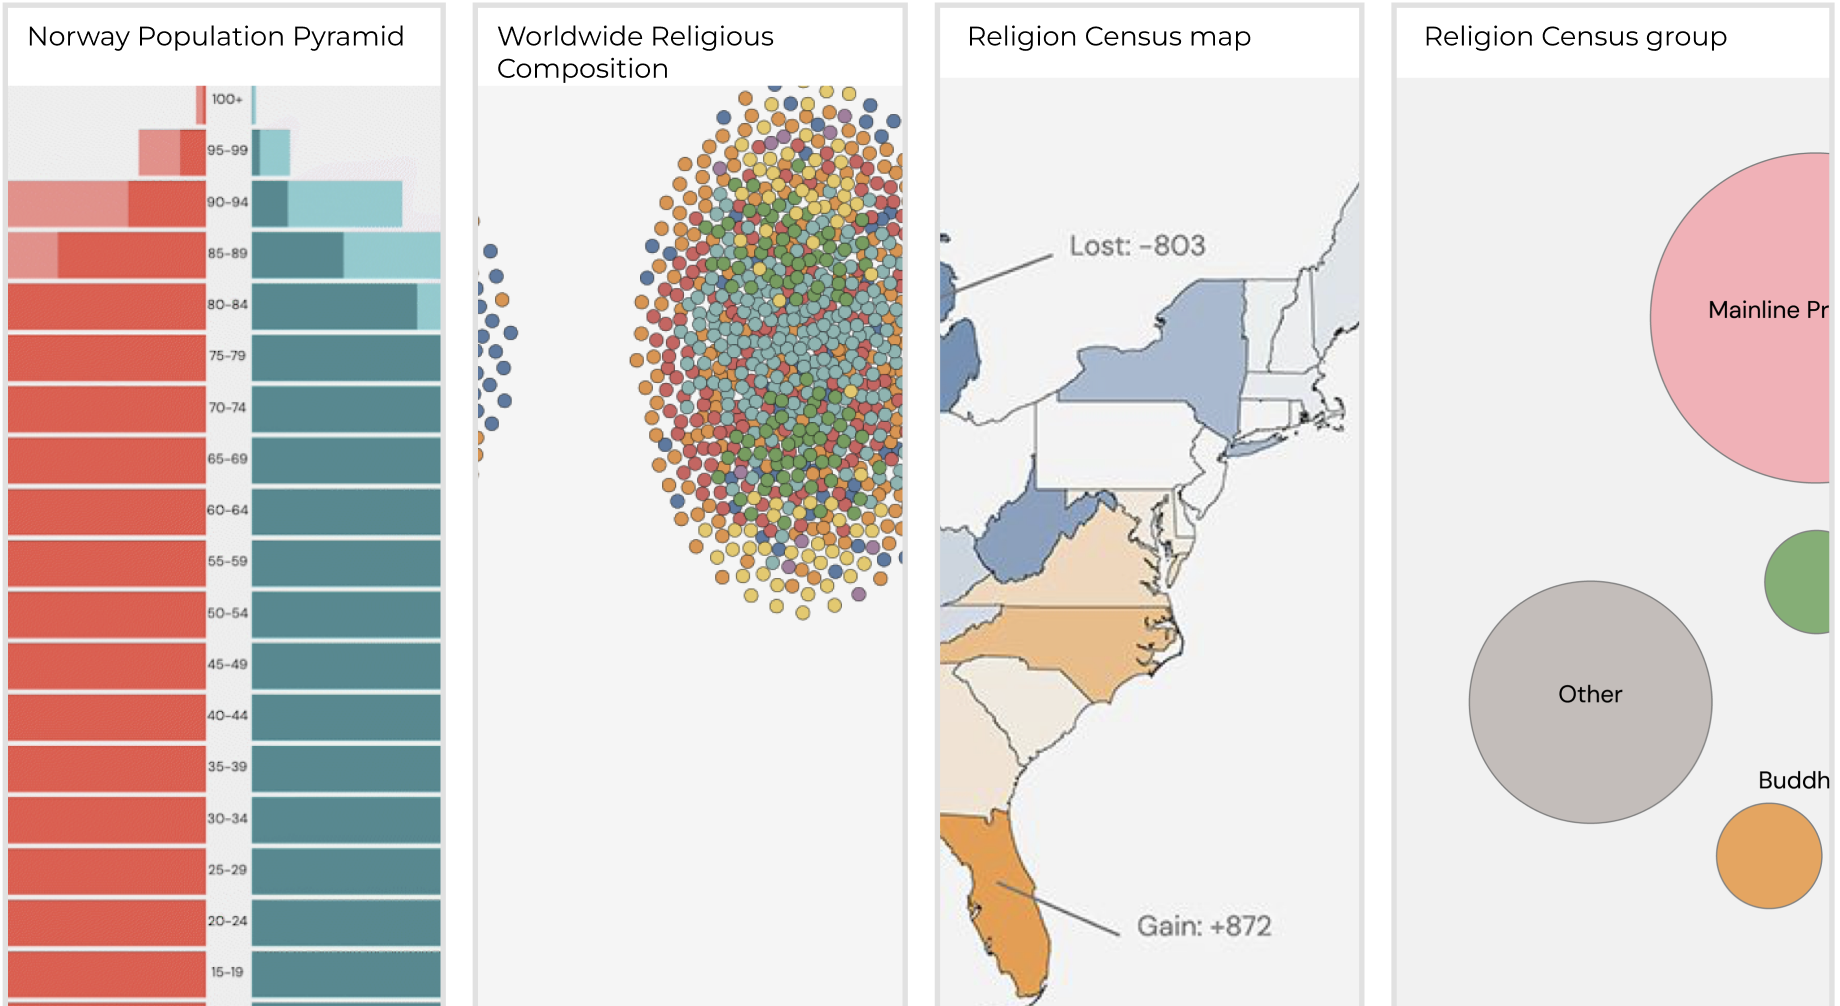
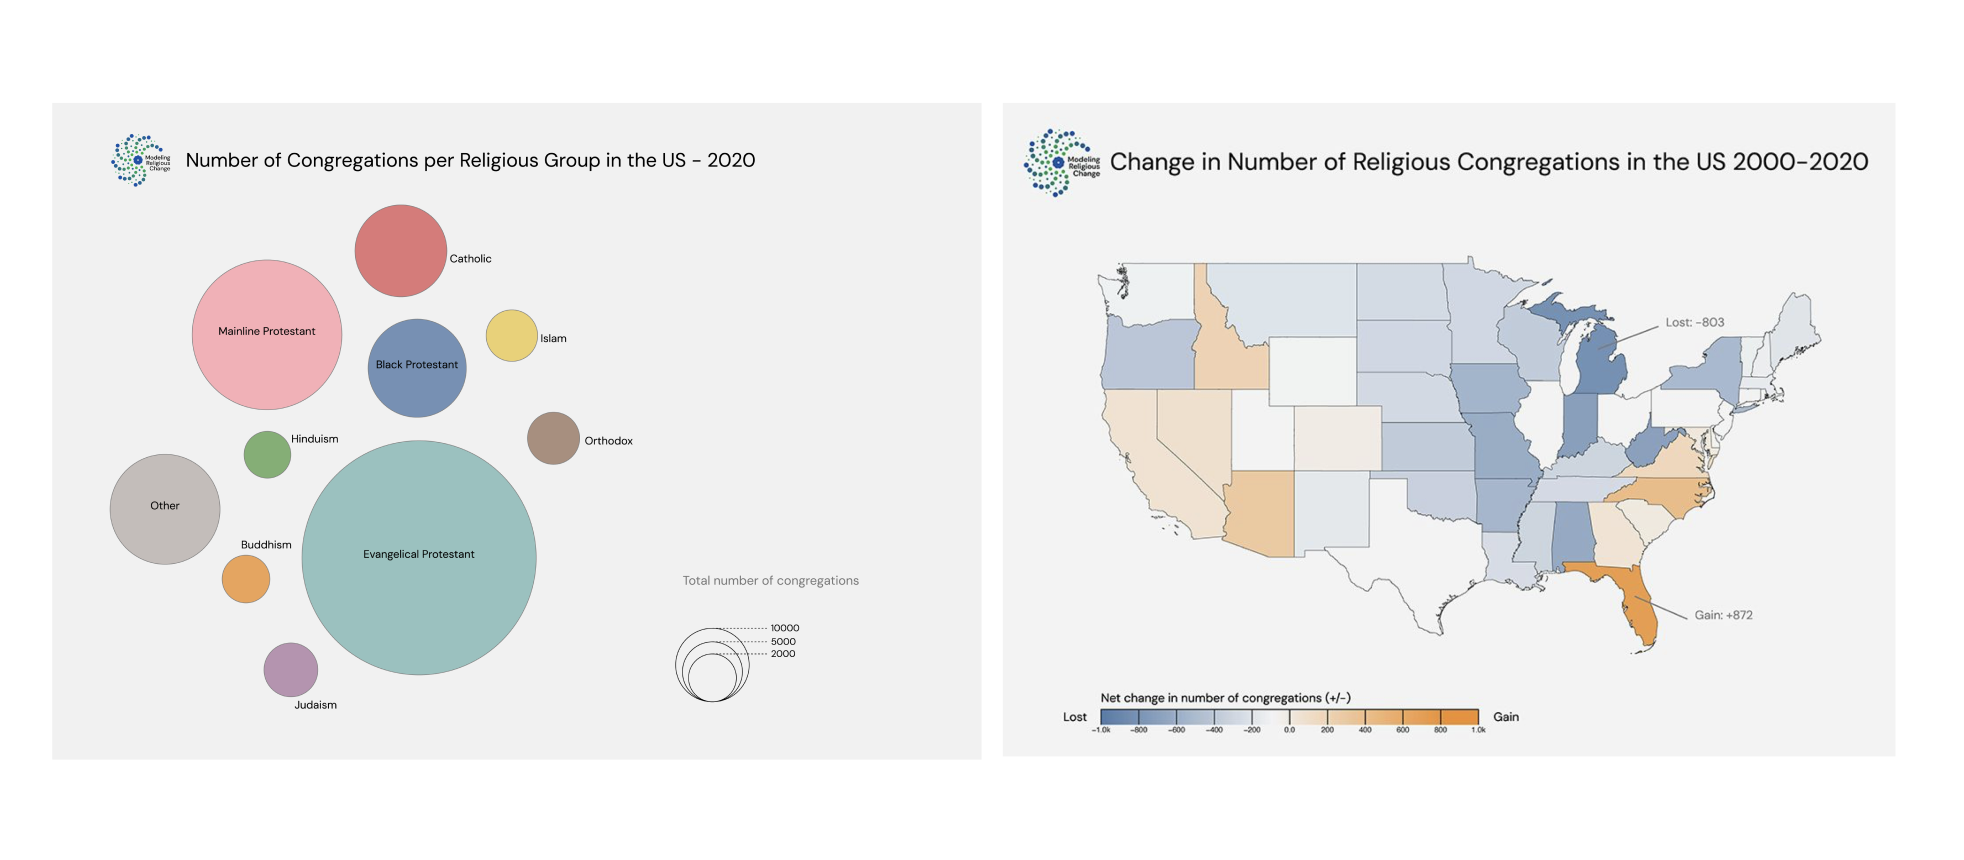
Blog Post 1: 2020 Religion Census
https://modelingreligiouschange.org/2020-religion-census/
Goal
Observe geographical distribution.
Observe differences.
Blog Post 2: population pyramid of Norway from 1950 projected to 2100
Goal
Observe population change over time.
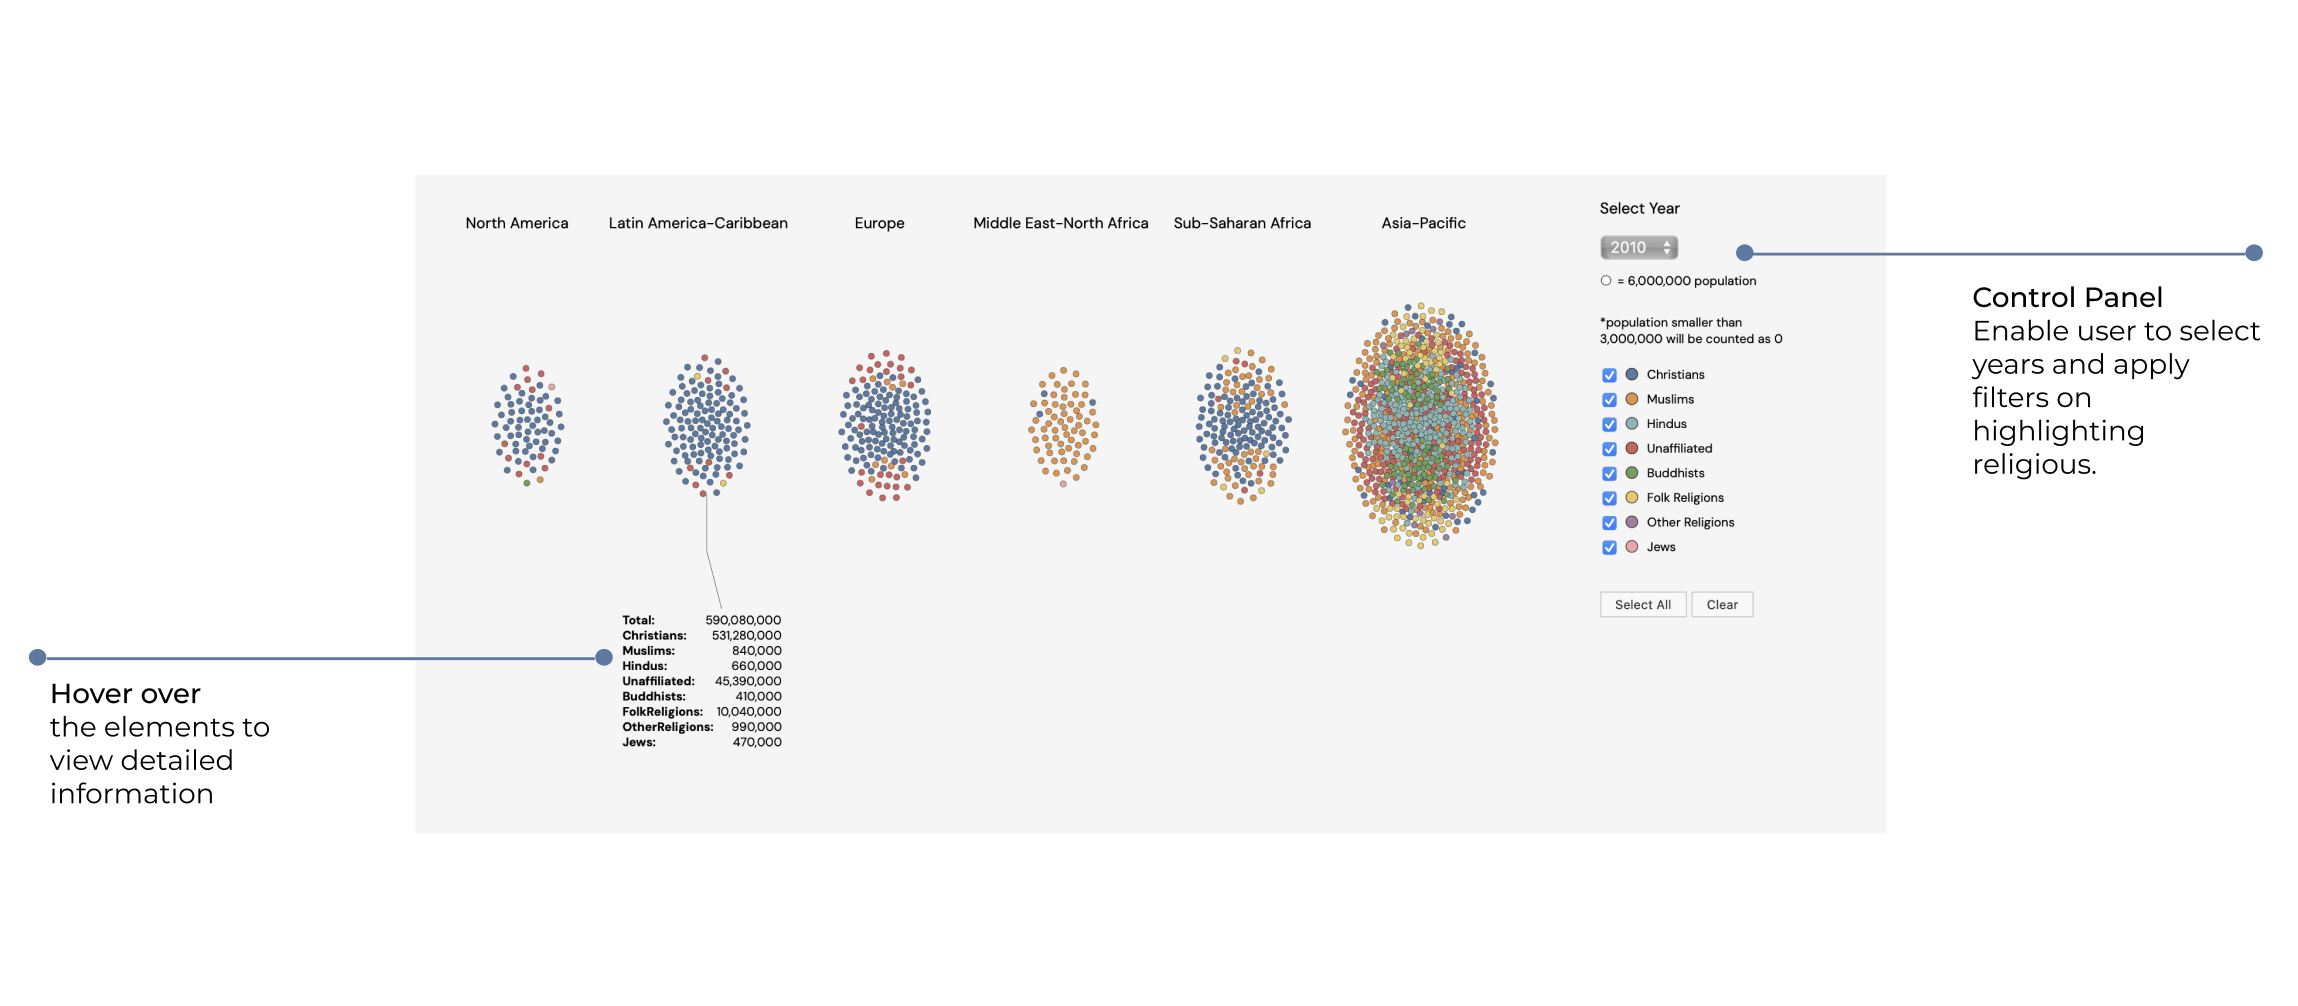
Blog Post 3: Religious composition by region 2010-2050
https://modelingreligiouschange.org/religious-composition-around-the-world/
Goal
Explore distribution, amount, and trending
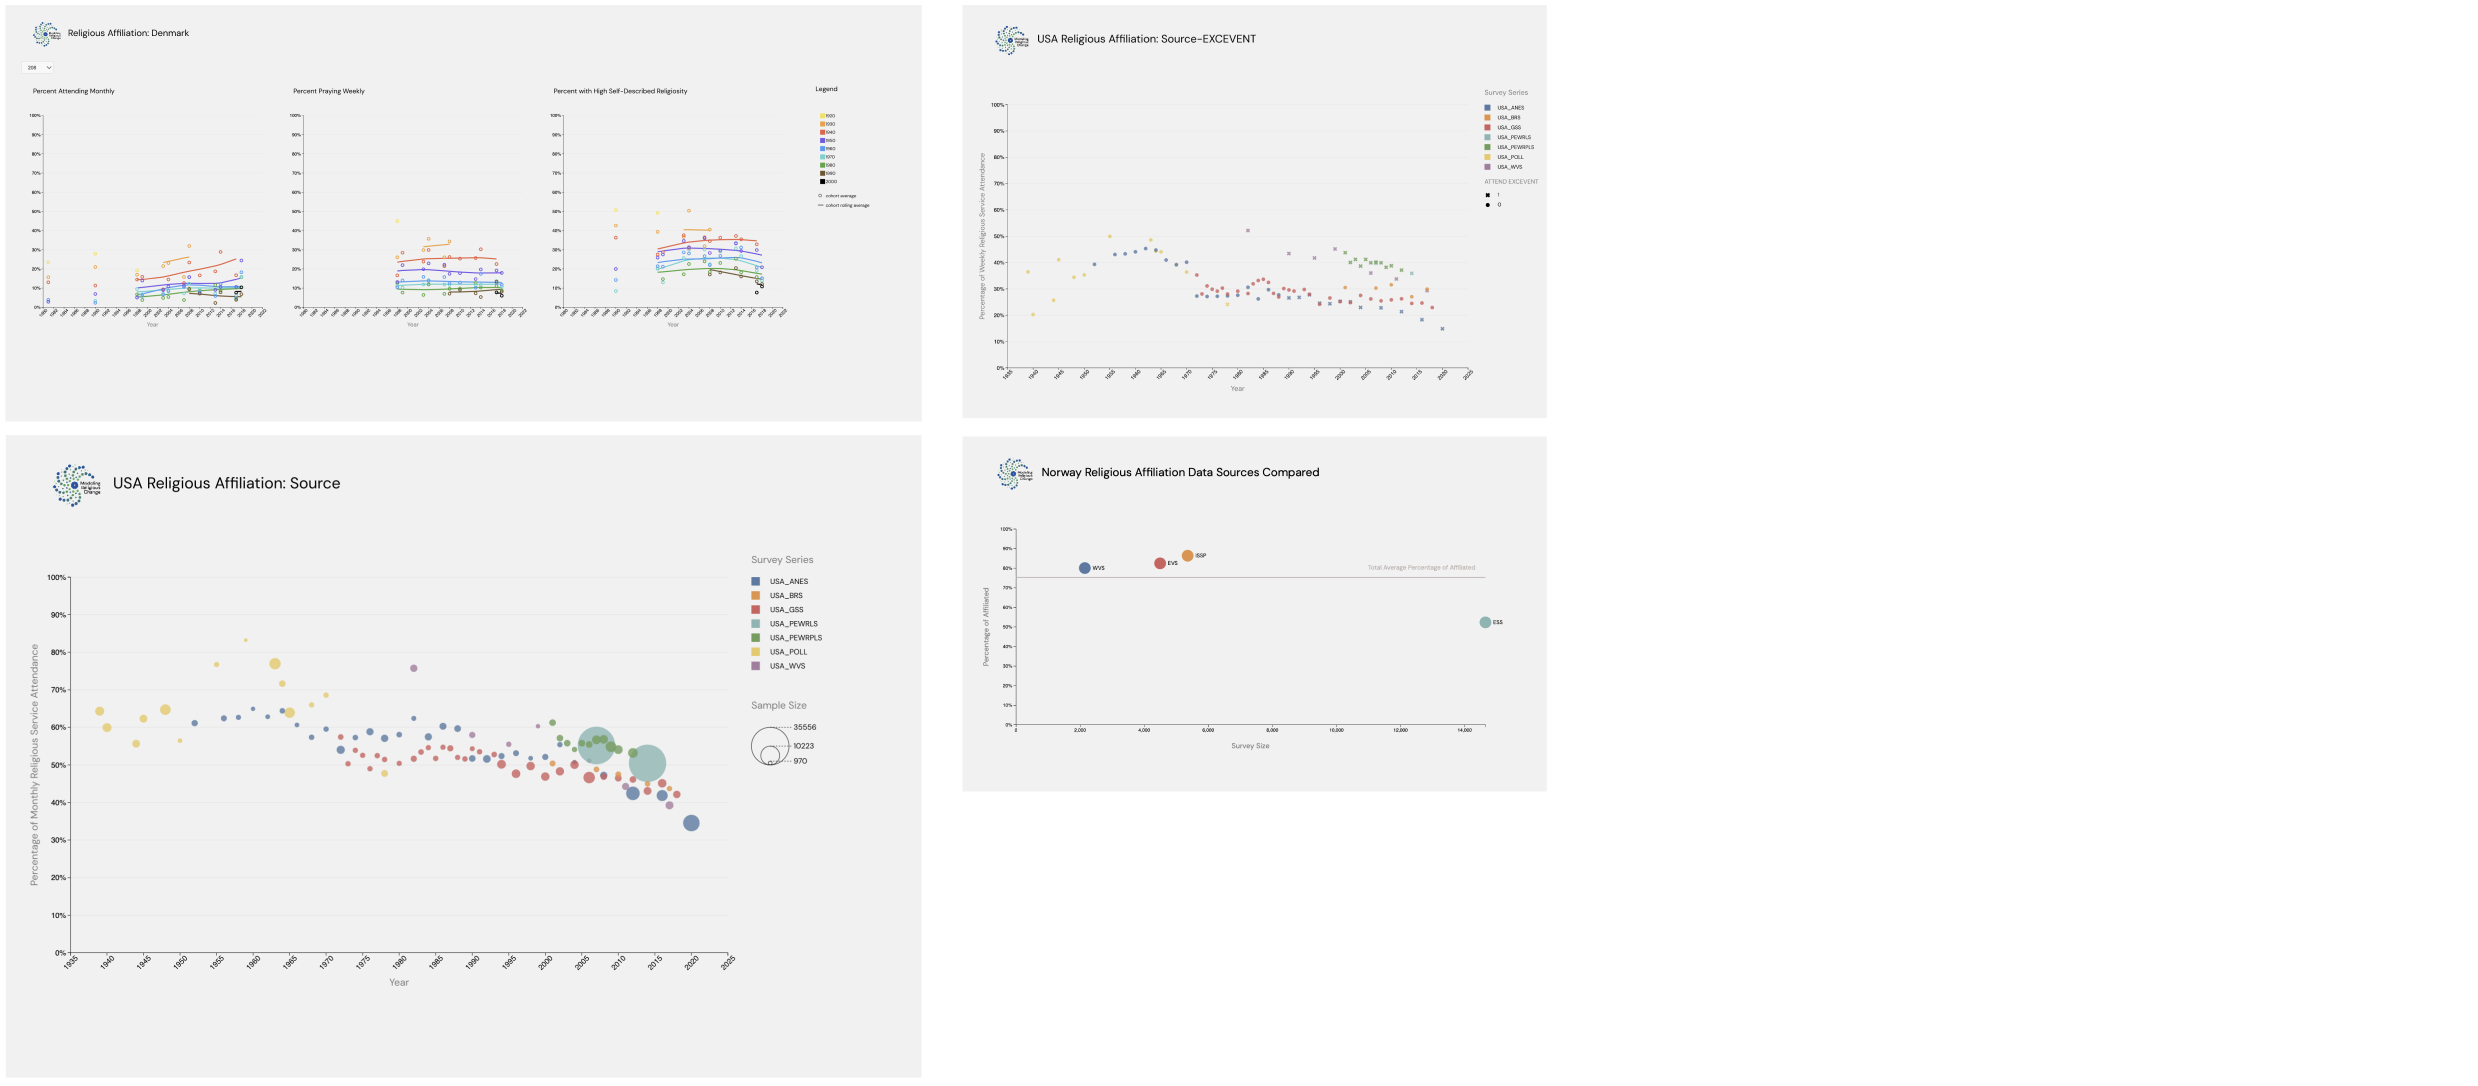
Scholar Publication - Design Detail
Color:
In addition to Tableau 10, I designed a color scheme for the needs of more contrast.

Form:
Using the basic scatter plot and line chart to best match researcher’s familiarity.